
The Next Recession and the Seventh Inning Stretch
Is the next recession coming soon? You might think so, based on the current market correction and accompanying hand wringing on CNBC and other business “news” outlets. But recessions don’t begin in the news media (the talking heads are almost always behind the curve) and they are not caused by market drops (see October 1987, and the Black Monday that didn’t usher in the Second Great Depression).
Recessions, to paraphrase a Milton Friedman quote that I used in my last blog post, are almost always and everywhere a monetary phenomenon. Of course, the exception to that rule was 2020, but by the classic definition of a recession – two consecutive quarters of declining GNP – 2020 doesn’t qualify, as economic growth resumed after a 3 month hiccup.
What do I mean by a “monetary phenomenon?” In this case, I’m referring to “tight money:” credit conditions that make it difficult for businesses to borrow and invest profitably. The two most reliable indicators of tight money are an inverted yield curve and a negative Real Fed Funds rate. This chart from the always dependable Scott Grannis at Calafia Beach Pundit illustrates their effect upon the economy quite nicely:1
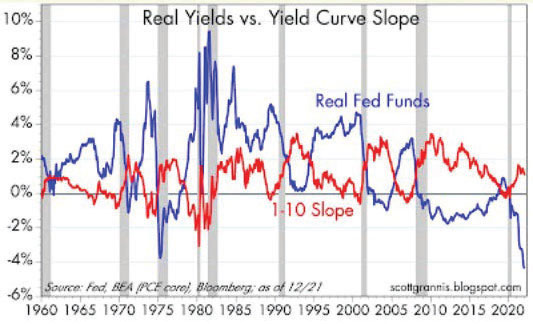
If the blue line – Real Fed Funds – is positive it means that the Fed Funds rate is higher than inflation. When it’s negative, it means that inflation is running above Fed Funds. A decreasing Real Fed Funds rate is a signal that credit conditions are easing, while an increasing one means money is tightening. As you can see, every recession since 1960 has been preceded by a significant increase in the Real Fed Funds number.
We are not anywhere near pre-recession conditions right now; since 1960, we have never had a Real Fed Funds rate this low. The relationship between interest rates and inflation is now very stimulative. The recent market drop was caused in part by the recognition that, given the current inflation climate, the Fed will start to raise rates and end quantitative easing very soon. But the Real Fed Funds rate will not be climbing to +3% anytime soon, which has typically been a trigger point in the past. However, I do have a hunch that it will not take a +3-6% Real Fed Funds Rate to usher in the next recession. What is possibly more important than the absolute level of the RFFR is the amount that it increases. In that case, a move from the current -5% to 0 could be enough to tip the economy. We will be watching this closely.
An inverted yield curve – the red 1-10 Slope – has also preceded every recession since 1960. The “1-10 Slope” is the difference between 1 and 10 Year Treasury Note yields. When short rates are higher than long rates, that is another indicator that credit conditions are restrictive. At the moment, 10 year rates are still a fairly comfortable 1% above 1 year rates (1.79% vs. .78%).2
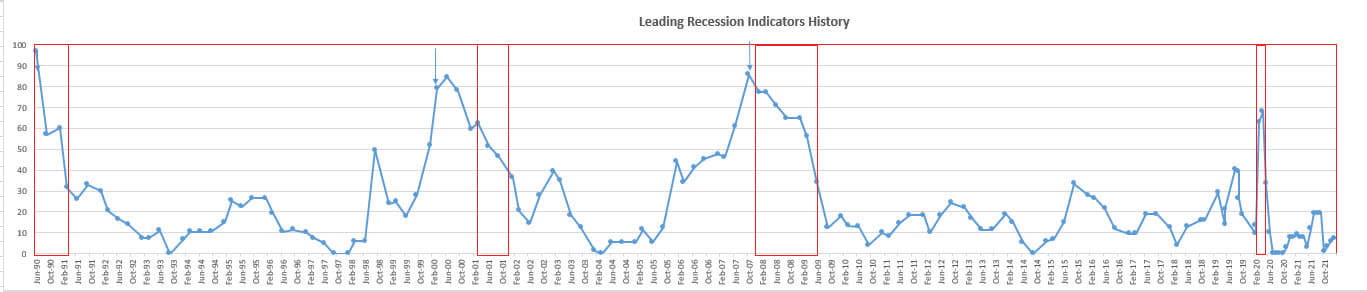
In addition, my Leading Recession Indicators,3 which include monetary policy along with a number of other factors, are nowhere near the 70-100 levels that would normally signal the possibility of an upcoming downturn. Though they moved up to 20 a few months ago due to housing softness, that was more of a supply issue and now seems to have resolved itself.
We may not be on the cusp of a recession at the moment, but how might the interplay between inflation and interest rates that typically precedes a downturn play out in the future?
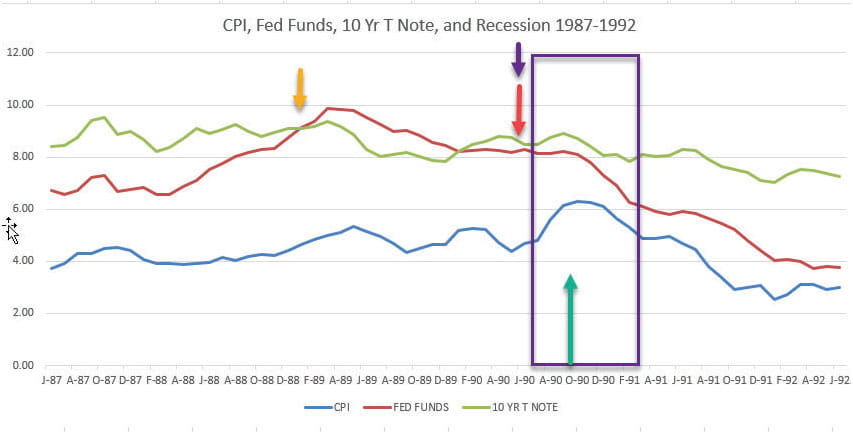
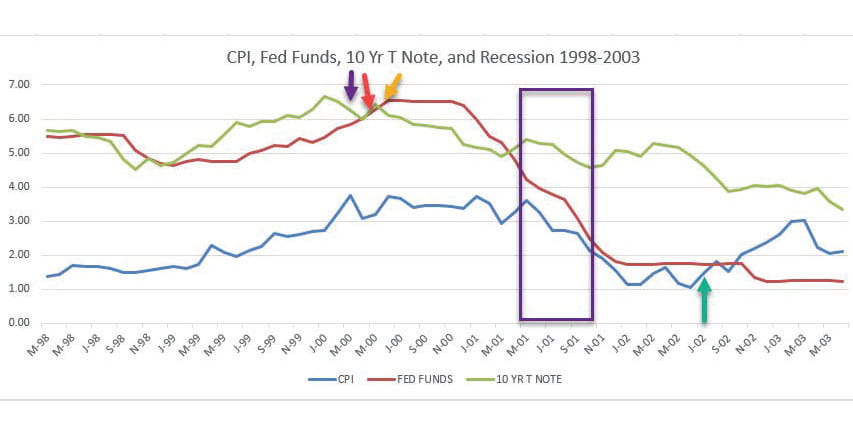
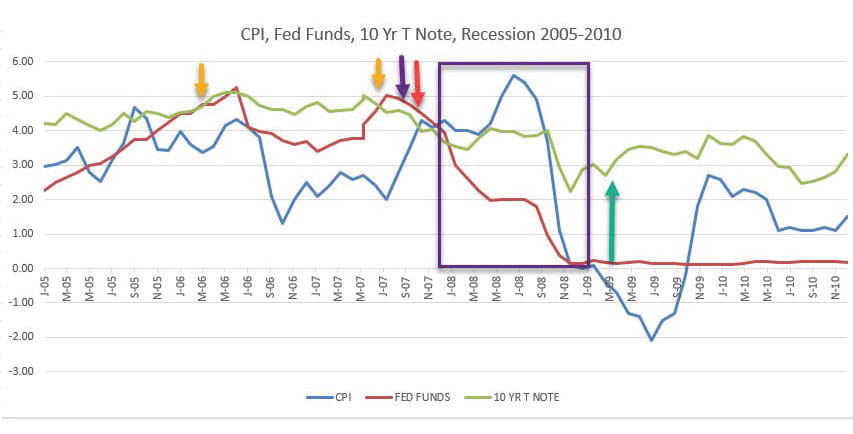
Below are charts that show the Consumer Price Index (blue line), the Fed Funds Rate (red line) and the 10-Year Treasury Note yield (green line), in the periods before and after all recessions between 1970 and 2008.4 The purple box denotes a recession.
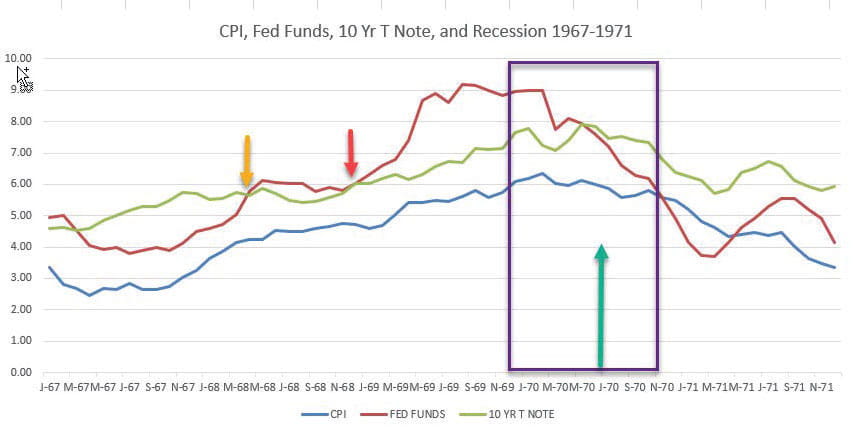
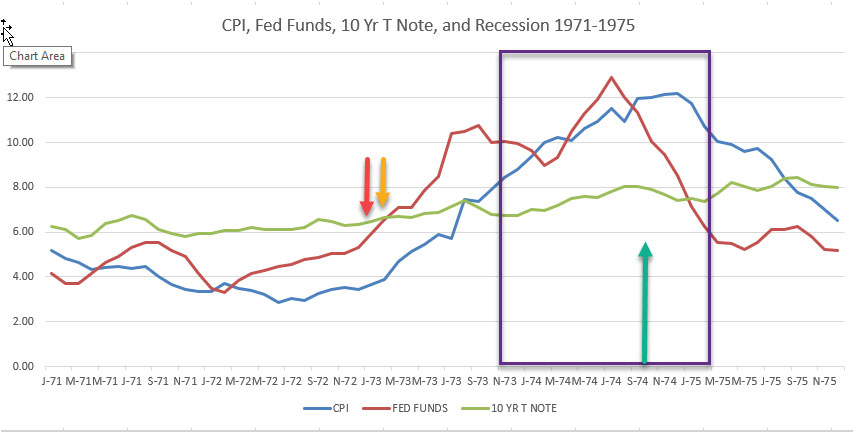
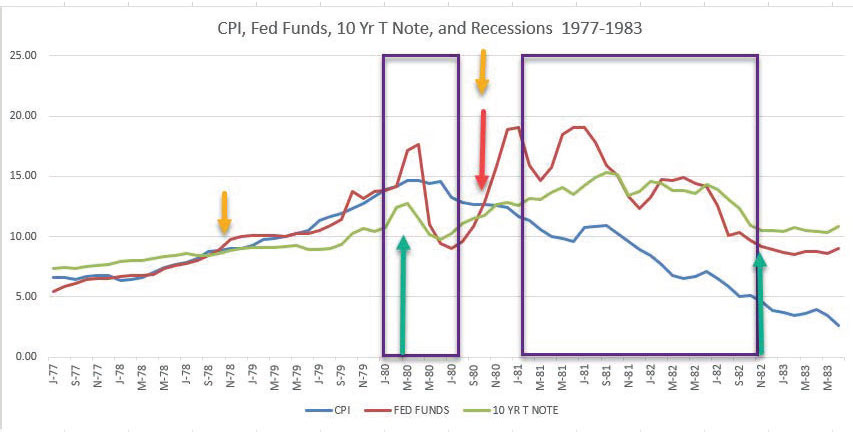
A fairly typical pattern presages each recession. Inflation, the Fed Funds Rate and the yield on the 10-Year Treasury Note all begin to rise. There is no regular sequence. One recession, the Fed might lead the move, and the next time around it could be a laggard. But it is interesting to note that in the recessions from 1970 to 2008, either the Fed or the 10-Year T Note moved before inflation began to rise. This time around, the yield on Treasuries began to move up in August of 2020, and inflation kicked-in in March of ’21. The Fed will not begin to raise rates until March of ’22, almost a year after this CPI surge began. Since 1967, the Fed has never been this late to the party, which is noteworthy, given the magnitude of the inflation increase that we have had.
Is there a discernible trigger in these numbers that tips us into recession? It’s pretty clear that it is the point where a rising Fed Funds rate moves above a flat or rising 10- Year Treasury Note yield (yellow arrow). Since 1967, every time this has occurred, a recession has followed.
In the past, how long has it taken for this tightening of credit conditions to cause a recession? In 5 of the 6 recessions since 1967, the lag time has been anywhere from 9-20 months. For the 1981 recession it was only 3 months, but I usually count the “double-dip” of the 1980 and 1981 downturns as a single event, as do many economists.
The stock market has typically topped out (red arrow) either after the yield curve has inverted, or almost simultaneously. (The purple arrow is the point where my Leading Recession Indicators gave a sell signal. The green arrow is where the stock market bottomed during or after the recession.)
Where do I think that leaves us today? We are not close to an inverted yield curve. Credit may begin to tighten somewhat as the Fed raises rates, but that does mean it will be “tight.” We are clearly not in the first inning of the market cycle, but we’re also probably not in the ninth. Most likely we are somewhere around the “seventh inning stretch.”
Don Harrison
1 Calafia Beach Pundit, http://scottgrannis.blogspot.com/2022/01/m2-and-nominal-gdp-update-stillgrowing.
3 Red boxes indicate recessions. The Capitalist Investment Leading Indicators is a composite comprised of the following data: Real Yields and the Yield Curve Slope; 1-10 Treasury Slope; Five Year vs. Overnight Risk Free Yields; 2-10 Treasury Spread; 2-10 Treasury Spread and Real Fed Funds; 10-30 Treasury Spread; 10-30 Treasury Spread and Real Fed Funds; 2 Yr. Swap Spreads; Corporate Credit Spreads; Corporate Profits as a % of GDP; Institute for Supply Mgn PMI; Capacity Utilization; 24 Month Payroll; Small Business Optimism; Small Business Hiring Plans; Consumer Confidence; Light Vehicle Sales; Unemployment Rate; State Unemployment Rates; Year/Year Change in Employment; Heavy Truck Sales; Initial Weekly Unemployment Claims; U.S. Household Leverage; Housing Starts; New Home Sales; NAHB Indicator; New Homes Supply; Housing Starts 12 Month Average
4 CPI info: https://www.bls.gov/charts/consumer-price-index/consumer-price-index-by-category-linechart.htm Fed Funds info: https://fred.stlouisfed.org/series/FEDFUNDS Treasury Note info: https://www.macrotrends.net/2016/10-year-treasury-bond-rate-yield-chart
The information contained in this report does not purport to be a complete description of the securities, markets, or developments referred to in this material. The information has been obtained from sources considered to be reliable, but we do not guarantee that the foregoing material is accurate or complete. Any opinions are those of the author and not necessarily those of Raymond James. Expressions of opinion are as of this date and are subject to change without notice. There is no guarantee that these statements, opinions or forecasts provided herein will prove to be correct. Investing involves risk and you may incur a profit or loss regardless of strategy selected. Keep in mind that individuals cannot invest directly in any index, and index performance does not include transaction costs or other fees, which will affect actual investment performance. Individual investor's results will vary. Past performance does not guarantee future results. Future investment performance cannot be guaranteed, investment yields will fluctuate with market conditions.
The Consumer Price Index is a measure of inflation compiled by the U.S. Bureau of Labor Studies. US government bonds and treasury bills are guaranteed by the U.S. government and, if held to maturity, offer a fixed rate of return and guaranteed principal value. U.S. government bonds are issued and guaranteed as to the timely payment of principal and interest by the federal government.
Links are being provided for information purposes only. Raymond James is not affiliated with and does not endorse, authorize, or sponsor any of the listed websites or their respective sponsors. Raymond James is not responsible for the content of any website or the collection or use of information regarding any website’s users and/or members.
